RZH Insights: Is Your Index fund Really “Passive”?
In last month’s edition of RZH Insights, Brendan McEwan walked us through the latest SPIVA® (S&P Indices Versus Active) U.S. Scorecard – a ledger of evidence showing that the vast majority of active fund managers have failed to beat their benchmarks over time.1 The data was striking: 79% of active large-cap U.S. equity funds underperformed the S&P 500 Index in 2025 on an absolute basis, and over a 15-year horizon, the numbers climbed to nearly 90%.2
These results beg the question: What is it about the S&P 500 Index that makes it so difficult to beat?
The S&P 500, and the investment vehicles that track it, are commonly labeled as “passive” investments, suggesting a static list of 500 companies, assembled mechanically, requiring no human judgment. That assumption could not be further from the truth, and a look under the hood reveals a highly dynamic index that, as we will soon see, is built on the same principles that underpin RZH’s approach to long-term investing.
Behind the Curtain: How the S&P 500 Is Actually Built
The S&P 500 is not simply the 500 largest companies in the United States. It is a curated index, selected and maintained by a committee of analysts and economists at S&P Dow Jones Indices who meet monthly and exercise real discretion over its composition.3
To even be considered for inclusion, a company must clear several hurdles: a minimum market capitalization of $22.7 billion (as of July 2025), positive GAAP net income from continuing operations in the most recent fiscal quarter (and positive total net income over the four most recent quarters), minimum trading volume and liquidity requirements, and a sufficient public float.4 In other words, the Committee imposes a rigorous screen on size, quality, liquidity, and investability to determine the universe of companies eligible for inclusion, prioritizing large and liquid stocks with persistent earnings and weeding out thinly traded ones and those with sporadic or financially engineered profits. But meeting those criteria does not guarantee a seat. The Committee weighs additional factors, most notably sector balance, comparing each sector’s representation in the index against its weight in the broader U.S. equity market.5 If technology stocks are overrepresented relative to the total market, the committee may pass over an otherwise-qualified tech company in favor of a candidate from an underweight sector. This is a critical distinction. As S&P Dow Jones Indices states in its own methodology: the index is not rules based and all changes are “fully discretionary and are determined by the Index Committee.”6 Contrast this with the Russell 1000, which is purely mechanical: a company either meets the size threshold or it doesn’t.7 The S&P 500 involves human judgment at every turn. Indeed, while definitionally “passive,” one of the most widely held investments in the world rests on a foundation of active decision-making.
S&P 500 Eligibility Criteria
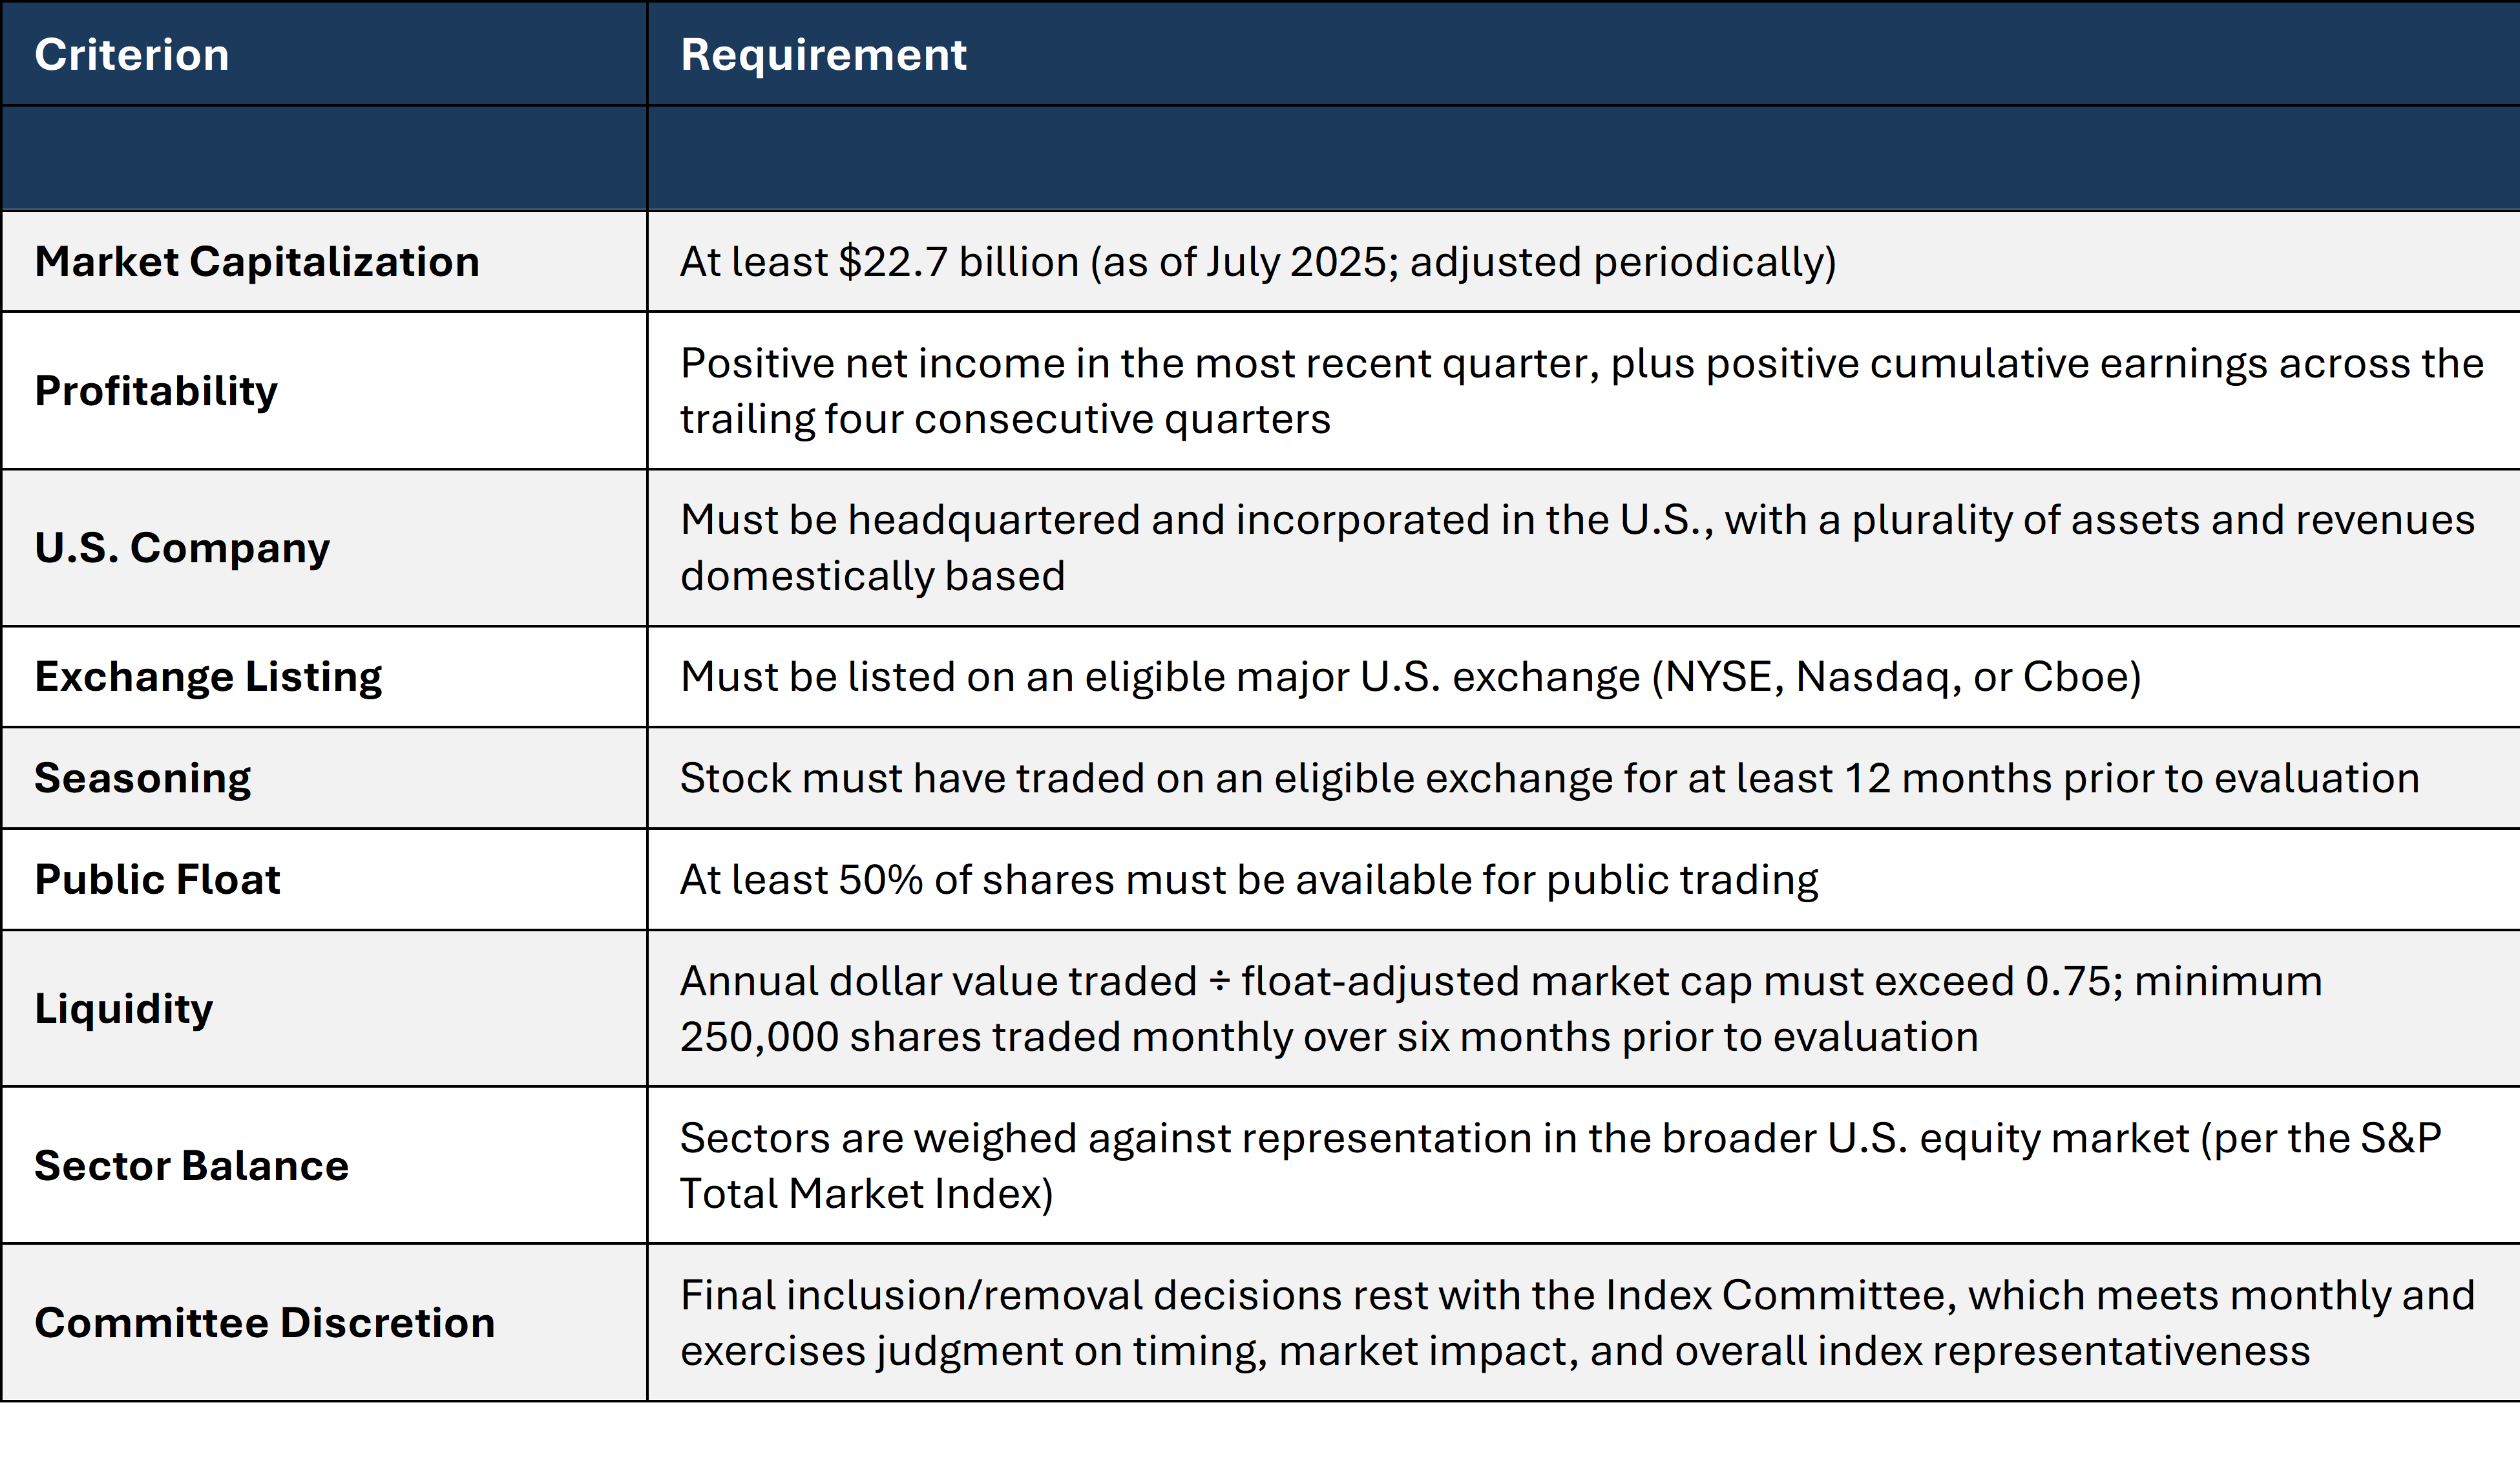
Source: S&P Dow Jones Indices, S&P U.S. Indices Methodology, April 2026; Investopedia; S&P Global
Built to Evolve
The committee’s work doesn’t stop at selection. The index is continuously reconstituted – companies are added and removed in response to mergers, acquisitions, financial deterioration, and shifts in the economy. On average, roughly 20-30 companies are replaced each year.8 A Goldman Sachs analysis published in early 2026 found that since 1985, approximately 20% of S&P 500 constituents turn over every five years.
The result is an accelerating pace of creative destruction within the index itself. Research from Innosight found that the average tenure of a company on the S&P 500 has declined from 33 years in 1964 to roughly 15 years today – and is forecast to shrink further in the years ahead.10 At the current churn rate, approximately half of today’s S&P 500 constituents will be replaced over the next decade!11
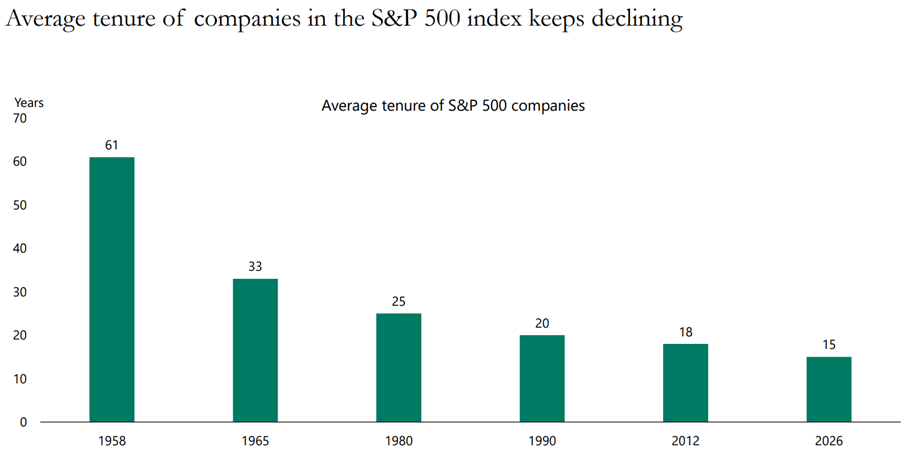
Sources: Creative Destruction Whips Through Corporate America, Corporate Longevity: Turbulence Ahead for Large Organizations – Executive Briefing, 2021 Corporate Longevity Forecast | Innosight, Apollo Chief Economist
Let’s take another look at the index’s evolution, this time focusing on the leaders over the past 50 years:
Top 10 companies in the S&P 500 by market capitalization
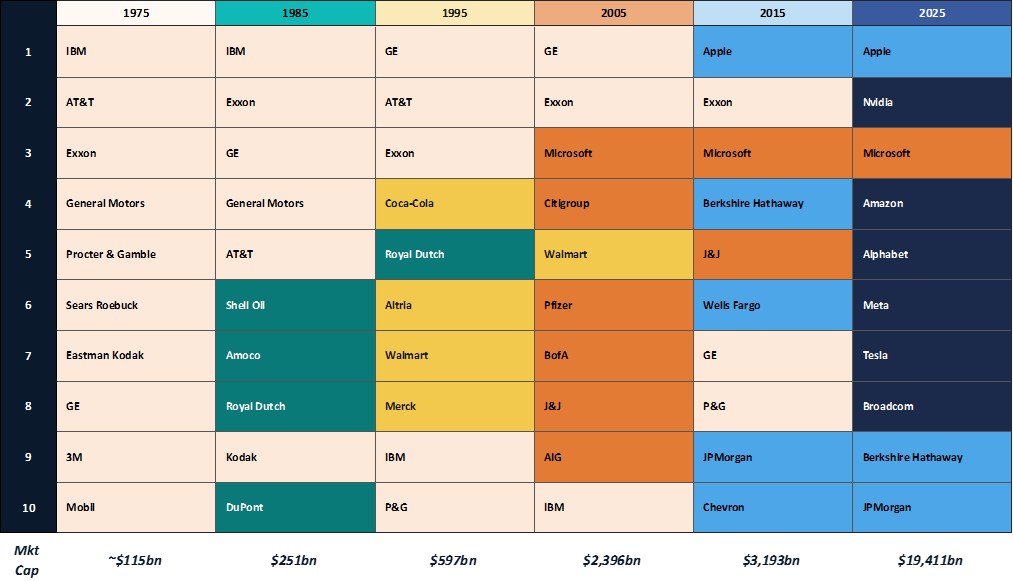
Source: 1985–2025: J.P. Morgan Asset Management Guide to the Markets, 1Q 2026 | 1975: Historical research
In 1975, the ten largest companies in the S&P 500 included IBM, AT&T, Sears Roebuck, Eastman Kodak, and General Motors – titans of the industrial economy.12 By 2025, every one of those names had either been replaced, acquired, or restructured beyond recognition. Today’s top ten reflect a fundamentally different economy, one driven by technology, cloud computing, and artificial intelligence. The combined market capitalization of the top ten has grown from roughly $115 billion in 1975 to over $19 trillion in 2025.12
The index didn’t ask anyone to predict that shift. It simply rewarded the companies that earned their way to the top and removed the ones that didn’t. Old economy stocks were replaced by new economy leaders. The cap-weighted structure ensures that the most successful companies naturally receive the greatest weight, while those that falter shrink in influence and are eventually shown the door.
This is not a static basket of stocks. It is a living, self-correcting representation of American enterprise.
A Level(er) Playing Field
The index’s built-in quality controls help explain part of its dominance as a benchmark. But active management was already a difficult proposition well before the index became a household name.
As Howard Marks, cofounder of Oaktree Capital Management, observes, “on average, all investors will do average.” Active management, in other words, “constitutes a zero-sum game (or negative-sum after commissions and other costs).”13 To outperform, a manager must consistently identify moments when consensus pricing is wrong and act on that judgment correctly. As markets have grown more efficient, access to information has proliferated, and the pool of well-resourced, sophisticated participants (human and non-human) has expanded, the odds of doing so consistently have narrowed.
A regulatory shift in the early 2000s raised the bar further. Before October 2000, publicly traded companies routinely disclosed material information – earnings guidance, product developments, strategic concerns – selectively to institutional investors and analysts before sharing it with the broader public.14 This information asymmetry gave active managers a genuine, structural edge. The analyst who had a direct line to a company’s CFO simply had better information than the rest of the market.
The SEC’s Regulation Fair Disclosure (Reg FD), enacted in August 2000, changed this by requiring companies to disclose material nonpublic information to all investors simultaneously, leveling the playing field overnight.15 Research by Gintschel and Markov supports this intuition, finding that the average price impact of information disseminated by financial analysts dropped by 28% in the post-regulation period.16
What This Means for Your Plan
The lesson here is not that you should only own index funds. A sound plan extends well beyond U.S. large-cap equities; it incorporates global diversification and tailors the portfolio to your specific circumstances as dictated by your plan. Active strategies can and do serve important roles within a well-constructed portfolio, whether that means generating tax efficiencies, managing around concentrated stock positions, expressing personal values, or addressing any number of client-specific objectives that a broad index cannot. The question is not whether active management has value. It is whether the tools being used are serving a plan designed to achieve your most important financial goals.
The S&P 500 exemplifies a set of investment principles that, in our view, have generally been effective over long periods: own a diversified portfolio of high-quality companies, remain invested across market cycles, let the winners compound, prune what no longer works, rebalance with discipline, and remain patient.
These principles mirror those we employ in managing your wealth.
The companies at the top of the S&P 500 in 2045 will likely look different from today’s leaders -just as today’s leaders look nothing like those of 1975. That is not a flaw, but a feature of the system and a result of corporate innovation and the ability of successful companies to continue building, growing, and creating value over time. It means that neither the index, nor the plan built around it, depends on the permanence of any single company, any single sector, or any single chapter of the American economy. It depends on the enduring capacity of American enterprise to innovate, adapt, and grow – a resilience that has stood the test of time and will, in our view, continue to endure.
Wishing you all a wonderful summer ahead!
Best regards,

Austin Doebler, CFA®
Portfolio Manager
[1] McEwan, Brendan. “The Scorecard Never Lies: 25 Years of Proof That Indexing Wins.” RZH Insights, April 27, 2026.
[2] SPIVA® U.S. Scorecard, Year-End 2025. S&P Dow Jones Indices LLC. Past performance is no guarantee of future results. Investors cannot directly purchase an index.
[3] Blitzer, David. “Inside the S&P 500: An Active Committee.” Indexology® Blog, S&P Dow Jones Indices, August 7, 2014. See also S&P Dow Jones Indices, “S&P U.S. Indices Methodology,” April 2026.
[4] “What Are the S&P 500 Inclusion Criteria?” LegalClarity, April 2026
[5] S&P Dow Jones Indices, “S&P U.S. Indices Methodology,” April 2026.
[6] Ibid. See also RBC Wealth Management, “A Closer Look at the S&P 500.”
[7] FTSE Russell, “Russell U.S. Equity Indexes: Construction and Methodology.” Unlike the S&P 500, the Russell 1000 uses a purely mechanical, rules-based reconstitution process.
[8] S&P Dow Jones Indices, “S&P U.S. Indices Methodology.”
[9] Snider, Ben. Goldman Sachs Research, January 6, 2026.
[10] Innosight, “2021 Corporate Longevity Forecast.” See also “Average Tenure of Companies in the S&P 500 Index: 15 Years,” Apollo Academy, March 2026.
[11] The bar for removal from the index is intentionally higher than for inclusion. If a stock falls below the minimum threshold, it is not automatically removed; it stays “unless ongoing conditions warrant an index change” (S&P U.S. Indices Methodology). The Committee’s discretion also serves to dampen turnover due to temporary market or economic conditions. Consider AIG: the U.S. government’s bailout during the 2008 financial crisis left the Treasury owning over 90% of the company, technically violating the public float requirement, yet the committee chose not to remove it, as doing so would have amplified an already severe market panic. See Blitzer as quoted in “Passive-Aggressive? Behind the Curtain at S&P 500,” TheStreet; RBC Wealth Management, “A Closer Look at the S&P 500.”
[12] J.P. Morgan Asset Management, Guide to the Markets, 1Q 2026. Historical research for 1975 data. RZH Advisors.
[13] Marks, Howard. “I Beg to Differ.” Oaktree Capital Management Memo. See also Marks, Howard. The Most Important Thing: Uncommon Sense for the Thoughtful Investor. Columbia University Press, 2011.
[14] U.S. Securities and Exchange Commission, “Selective Disclosure and Insider Trading,” enacted August 2000. See also SEC Historical Society, “20th Anniversary of Regulation Fair Disclosure.”
[15] Ibid. SEC Press Release, August 15, 2000. ¹⁶ Gintschel, Andreas and Markov, Stanimir. “The Effectiveness of Regulation FD.” Journal of Accounting and Economics, 2004. See also Agarwal, V., et al., “The Effect of Regulation FD on Active Share and Fund Performance”; “Reg-FD and the Competitiveness of All-Star Analysts,” Journal of Accounting and Public Policy (2008).