RZH Insights – The Scorecard Never Lies: 25 Years of Proof That Indexing Wins
What the 2025 SPIVA Report tells us — and why, after a quarter century, the answer hasn’t changed.
Over the past year and roughly 2 weeks, U.S. equities have risen more than 45%1, while international markets are up over 41%2. RZH’s investment philosophy and disciplined approach have enabled our fully-invested clients to capture the majority – if not all – of this historic rally, once again reinforcing the value of our long-term strategy.
The benefits of this approach are further highlighted each year when S&P Dow Jones Indices publishes its SPIVA® (S&P Indices Versus Active) U.S. Scorecard — a detailed analysis of how actively managed funds fared against their benchmark indices. We have shared this data with you before, and we will continue to do so, because after 25 years it remains one of the most powerful and actionable truths in all of investing.
The year-end 2025 edition is in. And once again, the story is the same — only more so.
79% of all active large-cap U.S. equity funds underperformed the S&P 500 in 2025 — up sharply from 65% the year before, and the fourth-worst result in the scorecard’s history.3
Consider that for a moment: in a year when markets were volatile, when tariff fears briefly sent the S&P 500 into near-bear-market territory4, when stock-level dispersion reached its highest point since 20095 — in other words, in conditions that were supposedly ideal for skilled active managers — nearly four out of five still lost to the index.
There are a few nuances worth noting. Small-cap active managers had a relatively better year — “only” 41% underperformed, versus historical norms well above 60%.3 International managers also fared better than their large-cap U.S. counterparts, aided by strong non-U.S. performance and wider country-level dispersion. But here is the critical point: even in the “good” categories, a majority still failed to beat a simple index.
One Good Year Doesn’t Change a 25-Year Record3
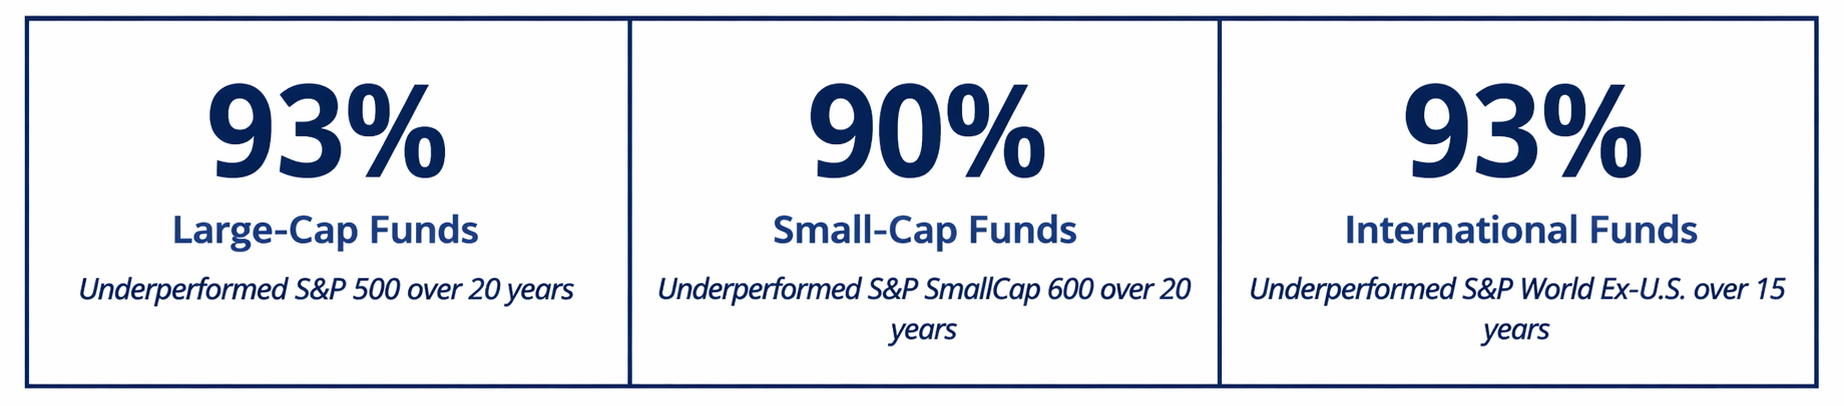
Source: SPIVA® U.S. Scorecard, Year-End 2025, S&P Dow Jones Indices LLC, CRSP. Data as of December 31, 2025.
Whenever a category of active managers has a decent year — as small-cap managers did in 2025 — the temptation is to conclude that the case for active management is being rehabilitated. We’ve seen this movie before. The data over longer time horizons tells a very different story.
Below are the underperformance rates for active managers across large-cap, small-cap, and international categories over multiple time horizons:3
Table 1: % of Active Funds Underperforming Their Benchmark (Absolute Return)3
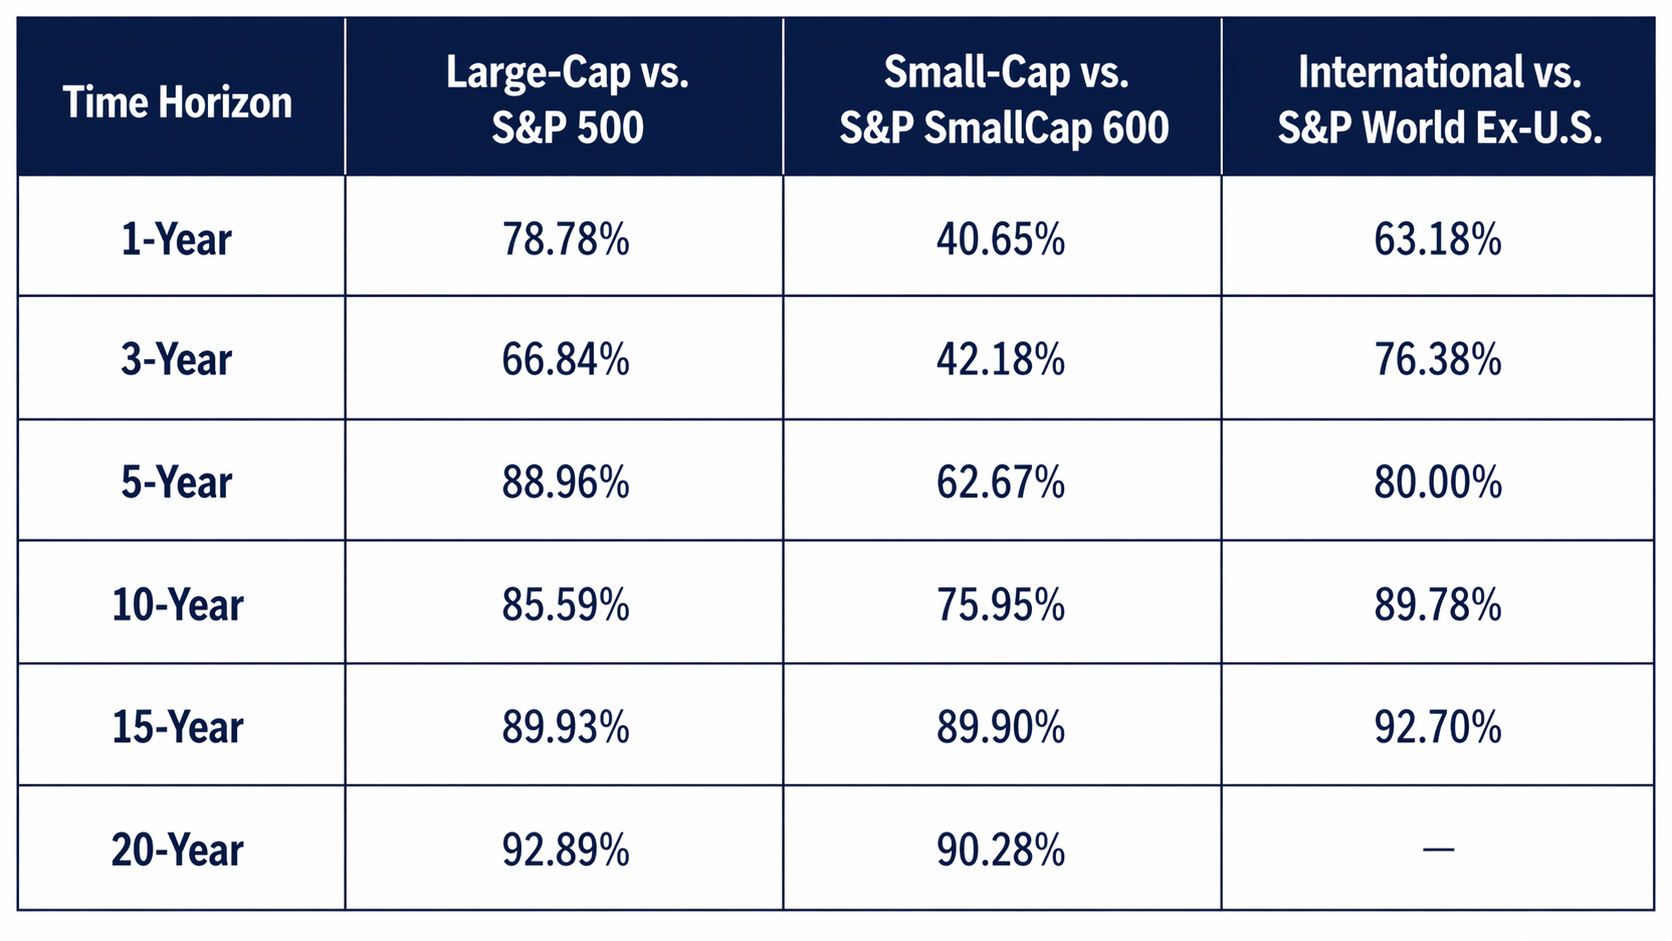
Table 2: % of Active Funds Underperforming Their Benchmark (Risk-Adjusted Return)3
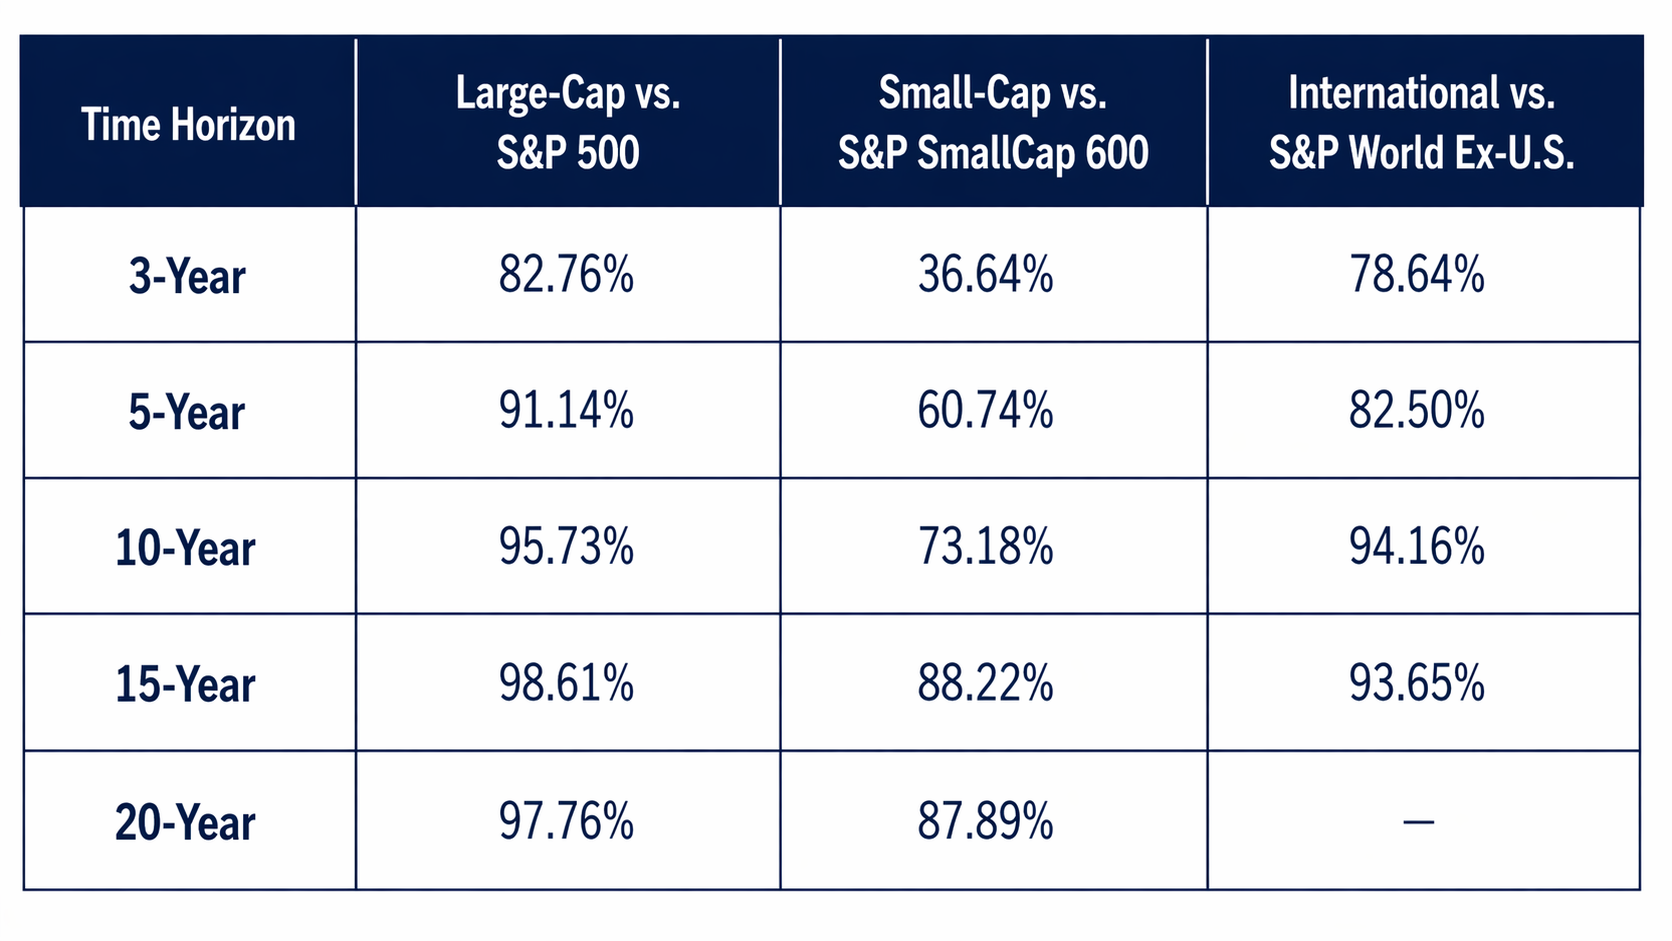
Source: SPIVA® U.S. Scorecard, Year-End 2025. Large-Cap: Report 1a/1b vs. S&P 500. Small-Cap: Report 1a/1b vs. S&P SmallCap 600. International: Report 6a/6b vs. S&P World Ex-U.S. 20-year international risk-adjusted data not available. Past performance is no guarantee of future results.
The charts show that whether measured on an absolute or risk-adjusted basis, the pattern is the same across all three categories: the longer the time horizon, the worse active management looks. The risk-adjusted numbers are even more striking — by 15 years, nearly 99% of large-cap managers and over 88% of small-cap managers failed to beat their benchmarks on a risk-adjusted basis. The second table, in particular, makes clear that active managers are not simply unlucky — they are taking on additional risk that is not being rewarded.3
What makes 2025 especially instructive is that this was supposed to be the year active managers finally had their moment. Heading into 2025, some of Wall Street’s most prominent voices declared that conditions were ideal for stock picking. Goldman Sachs published a piece in February 2025 titled “U.S. Equities Are Ripe for Stock Pickers,” with chief U.S. equity strategist David Kostin arguing that high single-stock dispersion, low correlation, and elevated policy uncertainty created “a favorable backdrop for stock pickers.”6 Morgan Stanley’s Global Investment Committee published a piece in June 2025 titled “It’s a Stock Picker’s Market,” contending that U.S. tax legislation and financial deregulation would drive wide return disparities across stocks and that “active investing remains crucial.”7 LPL Financial’s research team pointed to rising dispersion and falling stock correlations as signs that “investors may benefit from active management, selective stock picking, and sector-rotation strategies.”8 The conditions — tariff volatility, high dispersion, a potential broadening beyond mega-cap tech — genuinely seemed to support the thesis.
And yet, 79% of active large-cap managers still lost to the index. It is a perfect illustration of why the case for passive investing doesn’t rest on predictions about conditions — it rests on 25 years of evidence that those predictions never reliably translate into active outperformance.
“The stock market is a device for transferring money from the impatient to the patient.”
— Warren Buffett
What This Means for Your Plan
We have said it many times, and we will keep saying it: we are goal-focused, plan-driven, long-term equity investors. Our portfolios are built around your most important lifetime objectives — not around the futile pursuit of trying to find the next outperforming manager, or predicting which sector will lead next quarter.
The SPIVA data reinforces three convictions that are central to how we manage your wealth:
- Low-cost, broadly diversified index funds are not a compromise. We believe they are a mathematically sound strategy for the overwhelming majority of long-term investors. Twenty-five years of evidence supports our view.
- Past outperformance predicts virtually nothing about future outperformance. A manager who beat the benchmark last year is no more likely to beat it next year — and the longer the period, the more this truth asserts itself across every category we track.
- The tariff-driven selloff of early 2025 — when the S&P 500 briefly fell more than 20%9 from its February high — was precisely the kind of moment when investors are tempted to flee to an “expert” who can supposedly navigate the storm. As we wrote to you then: the best course of action was to stay the course. The market recovered to record highs. The active managers trying to time that recovery mostly got it wrong and were left behind.
Nick Murray, whose work on investor behavior has profoundly influenced our philosophy, puts it simply: “The greatest risk for long-term investors is not short-term volatility, but failing to achieve their long-term goals.”10 Pursuing active management — which often involves higher fees, turnover, taxes, and potential uncertainty — can increase the likelihood of that risk.
The 2025 SPIVA Scorecard is the latest page in a 25-year ledger. That ledger is unambiguous. We believe in owning great companies, broadly and efficiently, for the long term — and in helping you remain invested through every storm so that the extraordinary power of compounding can do what it has always done.
Crises end. Markets recover. The patient investor wins.
We welcome your questions, as always. Thank you for trusting us to be your partner on this journey.
Warm regards,

Brendan McEwan, CFP®, CIMA®
Senior Financial Advisor
[1] YCharts, Performance of S&P 500 Index as calculated from close on April 8, 2025, through close on April 24, 2026. Investors cannot directly purchase an index.
[2] YCharts, Performance of MSCI EAFE Index as calculated from close on April 8, 2025, through close on April 24, 2026. Investors cannot directly purchase an index.
[3] SPIVA® U.S. Scorecard, Year-End 2025. S&P Dow Jones Indices LLC, CRSP. Data as of December 31, 2025. Past performance is no guarantee of future results. Investors cannot directly purchase an index.
[4] “Trump Tariffs: Worried About a Bear Market? Look at This Chart.” CNBC, 7 Apr. 2025,
[5] “Dispersion, Volatility & Correlation Dashboard,” S&P Dow Jones Indices LLC, Dec. 31, 2025.
[6] Kostin, David. “U.S. Equities Are Ripe for Stock Pickers.” Goldman Sachs Research, February 21, 2025.
[7] Shalett, Lisa. “It’s a Stock Picker’s Market.” Morgan Stanley Wealth Management Global Investment Committee Weekly, June 30, 2025.
[8] Turnquist, Adam. “Exploring Growing Dispersion Trends in the S&P 500.” LPL Research, February 13, 2025.
[9] Yahoo Finance. Performance of S&P 500 Index as calculated from intraday high (6,147) on February 19, 2025, through intraday low (4,835) on April 7, 2025. Investors cannot directly purchase an index.
[10] Nick Murray, Simple Wealth, Inevitable Wealth. The Nick Murray Company, Inc. Referenced quote is widely attributed to this work.